DFL and AWS to debut two new Bundesliga Match Facts
10 September 2021 — Today, the DFL Deutsche Fußball Liga and Amazon Web Services (AWS) announced two new Bundesliga Match Facts powered by AWS that will premier as graphics during broadcasts and in the official Bundesliga app during the 2021-22 season. The first of the new advanced stats, Shot Efficiency, compares the number of goals that a player or team has scored with how many goals the player or team should have scored based on the quality of their chances. The second, Passing Profile, provides deeper insights into the pass quality of a player or an entire team. Both new stats will debut during Matchday 4.
Bundesliga Match Facts help audiences better understand nuanced aspects of the game, such as decision-making on the pitch or exceptional player performance. They are generated by gathering and analyzing the match feeds from live games in real time as they’re streamed into AWS. On the backend, AWS capabilities in analytics, machine learning, compute, storage, database, serverless, and media services are being used to process and store the vast amount of data that powers these statistics, as well as to train, deploy, and scale the machine learning models used to generate predictions. Fans see these insights as graphics during broadcasts and are provided with statistics in the official Bundesliga app. The two new Match Facts will better showcase the action on the field and give fans, coaches, players, and commentators visual support for analyzing players’ and teams’ decision making and performance.
Shot Efficiency
This new match fact helps to determine which players or teams are able to best exploit their chances at goal. It compares the number of goals that a player or team has scored with the cumulative Expected Goals (xGoals) value – an existing Bundesliga Match Fact – which is the number of goals the player or team should have scored based on the quality of their attempted shots. The difference between these two values is the Shot Efficiency. If the value is negative (shown by a red arrow pointing downwards), the player or team has scored fewer goals than would have been expected. If the value is positive (green arrow up), the expected value was exceeded.
For the first time, each player’s efficiency can be objectively assessed based on the overall quality of shots and the number of goals scored. For example, this advanced statistic can compare two strikers who scored the same number of goals after ten matchdays to determine which player is converting goals in challenging situations. Using xGoals values, Shot Efficiency analyzes for example if player have a high number of goals because they are well supported by their teammates or because they exploit small openings on the defense.
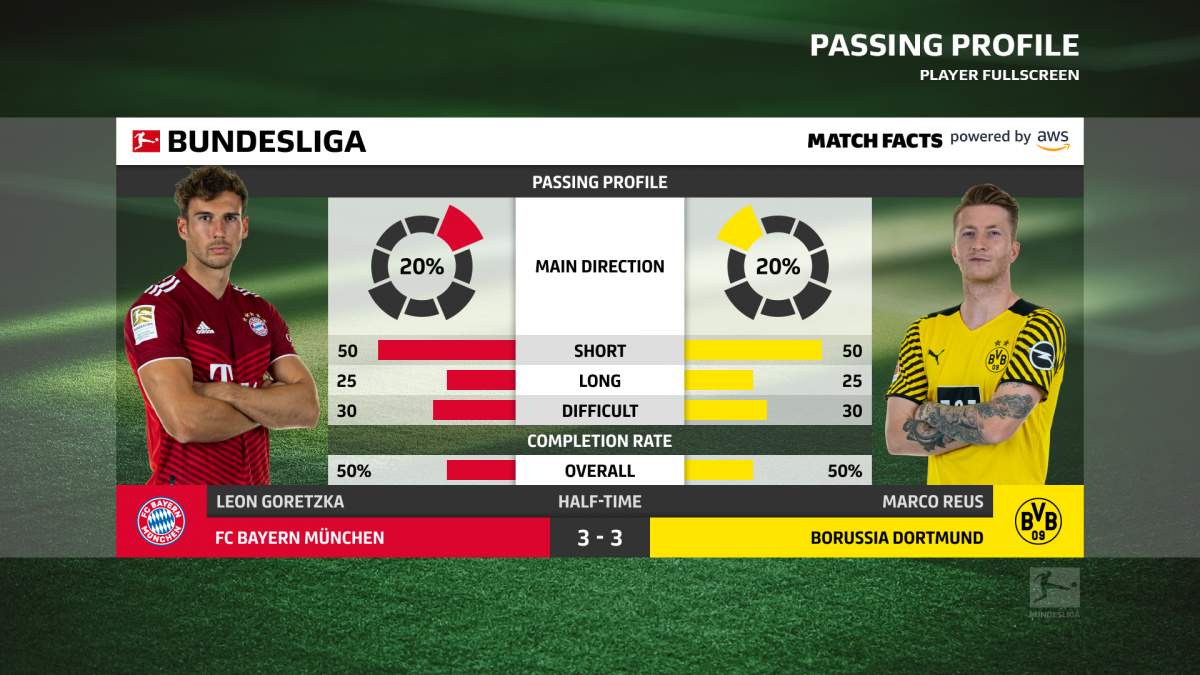
Passing Profile
Fans often put themselves into a player’s shoes and compare the choices they might have made in a given situation to what the player actually did. This new stat helps fans understand how players think and decide where to pass the ball. It also provides deeper insights into the pass quality and behaviors of players and teams, including which passing decisions they prioritize, such as an offensive pass, passing the ball back, or opening up play with a long ball. Additionally, Passing Profile uses the xPass model, which takes pass difficulty into account. By looking at how many opponents press the recipient and passer, how high the ball is in the air, and how many opponents were positioned between the recipient and passer, the stat calculates the pass difficulty rating.
In the live section of matches in the Bundesliga app and on the website, all fans can now see the players of both teams with the highest pass efficiency for each game. This shows whether a player has brought more or fewer passes than would have been expected based on his pass selection.
This new match fact also offers further insights into the passing behavior of a player or team by uncovering the number of long and short passes, pass direction, and the type of passes a player favors. A new graphic illustrates a compass-like overview of the directions of the passes played. There are eight different passing directions. The most frequently used one is highlighted in the graphic as the preferred direction.
To develop these stats, machine learning models trained on Amazon SageMaker analyzed thousands of video hours of previous Bundesliga seasons in the DFL Media Hub. In the case of Passing Profile, video of nearly 2 million passes were analyzed and the collected data were used to construct an algorithm that computes a difficulty score for each pass at any moment, evaluating characteristics such as distance to the receiver, the number of defending players in between, and pressure on a player in real time. Once computed, Bundesliga aggregates difficulty scores for each player and team to form a passing profile.
“Bundesliga Match Facts powered by AWS allows us to give fans more insight into the game of football, broadcasters further interesting stories to tell and coaches and teams, more data to excel at their game. Last year, the reception for Bundesliga Match Facts around the world was very positive, and we expect through ML and AI to continue to innovate on these analytics to make them even better. These two new stats give fans a view into player efficiency that hasn’t been achieved before, and we are just at the beginning of our relationship with AWS. I’m excited to see how technology will continue to evolve the fan experience and the game,” said Andreas Heyden, Executive Vice President of Digital Innovations for DFL Group.
“Teams, leagues, broadcasters, and their partners from across the sports world are using AWS to build data-driven solutions and elevate the fan experience. We’re excited to continue our work with Bundesliga to connect with their fans in a way they haven’t been able to before this collaboration,” said Klaus Buerg, General Manager for AWS Germany, Austria, and Switzerland, Amazon Web Services EMEA SARL. “Through the work we’ve accomplished with Bundesliga in creating eight Bundesliga Match Facts in a short period of time, we are giving fans a new way to appreciate speed, field positioning, goals, and passing and shot efficiency creating even more excitement in watching the game.”
These two new Match Facts join Speed Alert, Average Positions, xGoals, Most Pressed Player, Attacking Zones, and Average Positions – Trends to bring the total number of insights available for Bundesliga fans to eight. Information on all of these statistics can be found in the “MBF Zone” on Bundesliga.com.